How do you understand the evolutionary tree (Part I)
T. Ryan Gregory
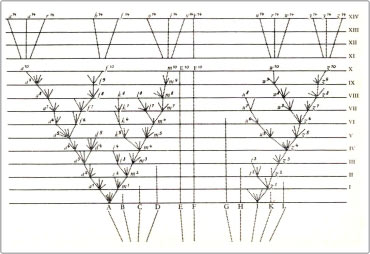
Only one image has made pages in Charles Darwin's Origin Species - first published in 1859 - with more fame. It is a tree -like scheme - resembling a tree branching over time based on the division of seed lines and the formation of new species on earth. The metaphor of a tree plays a very important role in Darwin's thinking about the origin of life.
Tree diagram in the book Origin of all species
Evolutionary biological theory has undergone significant changes over the past 150 years, but the concept of life trees still retains its central position. The area of phylogenetic research (animal group, formation and proliferation) was born with the aim to provide the hypothesis of an evolutionary relationship reflected in branched tree charts. The phylogenetic trees created, according to Baum et al (2005), 'are the most direct description of the common ancestor law - the core of evolutionary theory - so the understanding of the community is generally advanced. a special place must be reserved for phylogenetic trees'.
Unfortunately, in the process of studying evolutionary trees and the relationships it represents, there have been many misconceptions that have been widely spread. This started a series of misconceptions about the evolutionary tree as well as the information presented around it presented on the honor of Darwin 2008. The information was included in an upcoming article in Evolution: Education and Outreach.
Let us start with a simple tree that describes relationships based on reliable assumptions, between groups of vertebrates. For this diagram, the time is calculated from bottom to top. The root of the tree represents the time from ancient times and the top part (also known as the 'endpoint') is the dominance of contemporary species. The convergence point of the two branches (also called 'inner peaks') reflects the two species with common ancestors. Accordingly, two branches of cats and humans are converged by a common ancestor in the past - possibly an extinct mammal.
Lizards and birds also share ancestors (possibly an extinct reptile), and this group converges with the mammalian group at a lower point. This shows that all amniotic animals share a common ancestor. Amniotic membranes have the same origins as frogs at a lower point. At the root of the evolutionary tree (the lowest peak, or root) is the common ancestor of all these vertebrate animals.
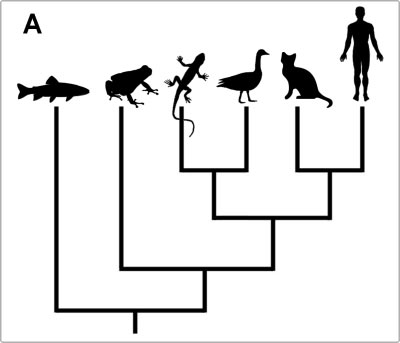
The question is: According to what you understand about the evolutionary sentence, which species has the closest relationship to fish: frogs, lizards, birds, cats or humans?
According to Baum et al. (2005), the intuitive answer that most people make is frog. After all, is the frog the closest relative to the fish in this tree graph?
Let's explore the tree chart below:
In your opinion, does this tree show different relationships? Does it imply that frogs and humans are closer relatives than the relationship between humans and reptiles? Is it less accurate than the first chart?

Contrary to our intuition, there are no differences in the information contained in these two, there are only differences in the order of branches. In both charts, people have the most common characteristics with cats. The mammalian group has slightly more ancestors with reptiles and birds. The ancestors of this group have a common origin with frogs. Then the ancestors of all four-legged species are also the ancestors of the bony fish of the same shape today. Since both frogs, humans, lizards, and birds share the same origin (an ancient four-legged animal), they all have similar relationships with fish.
Try thinking this way: you and your siblings share the same origin (your parents); Your siblings have a similar relationship with your cousins (those with your grandparents).
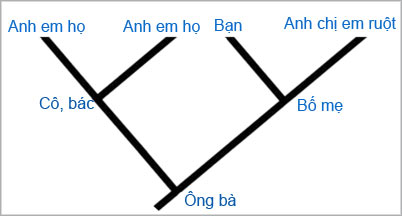
Thus, the evolutionary tree is mobile: each node or vertex can change its position freely without changing the path they are connected to. Therefore, the order of the last node is meaningless. We cannot understand that plants evolve based solely on information from trees.
The relationships represented on the tree chart are real in history. The final peaks represent groups of organisms that exist at the same time. When you see an evolutionary tree chart, try reciting some of the convergence points between the two branches. This is a simple exercise, but it is also an effective method to avoid common myths about evolutionary trees.
T. Ryan Gregory is an evolutionary biologist specialized in genetic evolution at Guelph University in Guelph, Ontario, Canada.He has a special interest in evolution, genome and ecological diversity.You can learn more from his articles on personal blogs - Genomicron.His own book The Evolution of the Genome also provides more information about his research areas.
-
Subscribe to DNA and Diversity
-
Subscribe to Genomicron
-
Subscribe to Pyrenaemata
References:
-
Baum, DA, S. DeWitt Smith, and SSS Donovan. 2005. Tree thinking challenge, Science 310: 979-980.
-
Gregory, TR 2008. Understanding evolutionary trees, Evolution: Education and Outreach.
-
Meir, E., J. Perry, JC Herron, and J. Kingsolver. 2007. Student Myth of Evolutionary Tree, American Biology Teacher 69: 71-76.
There's more
- How do you understand the evolutionary tree (Part II)
- Analysis of the organism genome to re-establish the evolutionary tree
- Decoding love song for frogs
- The dinosaur fossils perfectly match the evolutionary tree
- The oldest 9550-year-old tree from the Ice Age
- 'Tragedy' the world's largest carnivorous life: Death becomes ... public toilet
- Do plants have sex?
- The oldest tree in England has changed sex after 3,000 years
- Ancient trees have unique and strange shapes all over the world
- Mysterious fir tree regenerates itself from the dead
- He deciphered the ash tree sequence
- Story about 'devil tree': Witness the massacre of 1 family and many other deaths
 Why do potatoes have eyes?
 'Tragedy' the world's largest carnivorous life: Death becomes ... public toilet
 Tomatoes were once considered 'poisonous' for 200 years
 Are there insects in the figs we eat?